| Submit | All submissions | Best solutions | Back to list |
PROG0554 - Happy Planet Index |
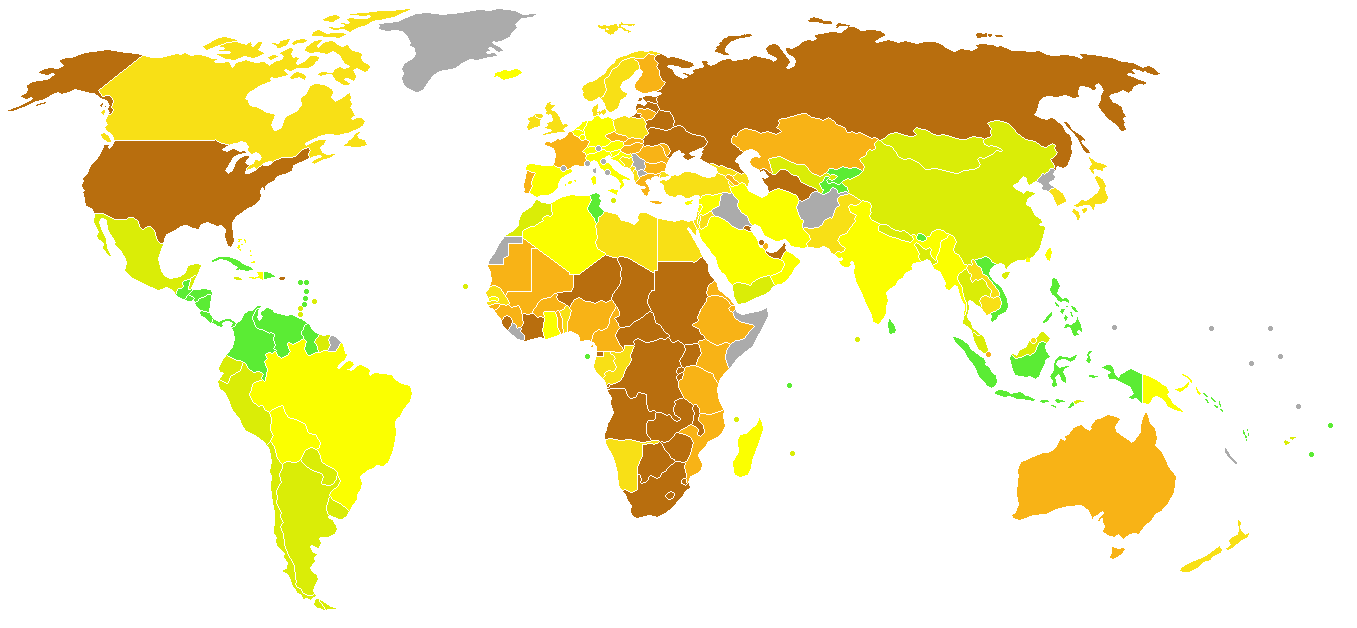
There is a growing global consensus that we need new measures of progress. It is critical that these measures clearly reflect what we value — something the current approach fails to do. The Happy Planet Index (HPI) measures what really matters. It tells us how well nations are doing in terms of supporting their inhabitants to live good lives now, while ensuring that others can do the same in the future, i.e. sustainable wellbeing for all.
The HPI is one of the first global measures of sustainable wellbeing. It uses global data on experienced wellbeing, life expectancy, and ecological footprint to generate an index revealing which countries are most efficient at producing long, happy lives for their inhabitants, whilst maintaining the conditions for future generations to do the same. $$\text{HPI} = \frac{\text{welzijn} \times \text{levensverwachting}}{\text{ecologische voetafdruk}}$$ At heart, the HPI is a measure of efficiency. It calculates the number of Happy Life Years achieved per unit of resource use. This simple headline indicator gives a clear sense of whether a society is heading in the right direction. It provides a vital tool for policymakers to ensure fundamental issues are accounted for in crucial policy decisions.
Input
The first line of input contains the name of a country. The following three lines each contain a floating point number. These numbers respectively give the experienced wellbeing, the average life expectancy, and the ecological footprint of the country.
Output
There's a single line of output that contains the sentence The HPI of country is hpi., where the italic fragments need to filled up with values derived from the input values. The placeholder country needs to be filled up with the name of the country. The placeholder hpi needs to be filled up with the computed HPI of the country. This value must be formatted as a floating point number with two decimal digits. Rounding must be used to determine the decimal digits.
Example
Input:
Belgium
6.9
80.0
7.1
Output:
The HPI of Belgium is 77.75.
Example
Input:
Germany
6.7
80.4
4.6
Output:
The HPI of Germany is 117.10.
Wereldwijd worden mensen zich steeds vaker bewust van het feit dat we dringend onze visie moeten herzien over wat vooruitgang betekent. Hierbij is het cruciaal dat we de manier waarop vooruitgang wordt gemeten, afstemmen op de dingen die we werkelijk belangrijk vinden. De statistieken die momenteel gebruikt worden om vooruitgang af te meten, schieten hierin duidelijk tekort.
De Happy Planet Index (HPI) meet wat echt telt. Ze vertelt ons hoe goed landen het doen om hun inwoners een goed leven te laten leiden, zonder daarbij de toekomst van volgende generaties te schaden en dus een duurzaam welzijn voor iedereen te garanderen.
In haar HPI rapport van 2012 onthult de New Economics Foundation dat we nog steeds op een ongelukkige planeet leven — waarbij zowel landen met een hoog als een laag gemiddeld inkomen voor verschillende uitdagingen staan om hetzelfde algemene doel te verwezenlijken. Maar het rapport toont ook aan dat een goed leven niet ten koste moet gaan van moeder Aarde — dat landen met het hoogste welzijn niet altijd die landen zijn die de grootste ecologische voetafdruk hebben.
De HPI is een van de eerste wereldwijde statistieken voor duurzaam welzijn. Ze is gebaseerd op gegevens over welzijn, levensverwachting en de ecologische voetafdruk om een index te berekenen die aangeeft hoe efficiënt landen zijn om hun inwoners een lang en gelukkig leven te laten leiden, en tegelijkertijd te garanderen dat toekomstige generaties hetzelfde kunnen doen. $$\text{HPI} = \frac{\text{welzijn} \times \text{levensverwachting}}{\text{ecologische voetafdruk}}$$ In essentie is de HPI een maat van doeltreffendheid. Ze berekent het aantal gelukkige levensjaren in functie van het gebruik van natuurlijke rijkdommen. Deze eenvoudige indicator laat duidelijk aanvoelen of een bepaalde gemeenschap in de goeie richting aan het werken is. Het is een essentieel hulpmiddel voor beleidsmakers om ervoor te zorgen dat fundamentele waarden worden afgetoest bij het nemen van cruciale beleidsmaatregelen.
Invoer
De eerste regel van de invoer bevat de naam van een land. Daarna volgen drie regels die elk een floating point getal bevatten. Deze getallen staan respectievelijk voor het waargenomen welzijn, de gemiddelde levensverwachting en de ecologische voetafdruk van het land.
Uitvoer
De uitvoer bestaat uit de zin De HPI van land is hpi., waarbij de cursieve fragmenten moeten ingevuld worden op basis de gegevens uit de invoer of berekende waarden. Op de positie land moet de naam van het gegeven land ingevuld worden. Op de positie hpi moet de berekende HPI van het land uitgeschreven. Deze waarde moet uitgeschreven worden als een floating point getal met twee decimale cijfers, waarbij afronding gebruikt wordt om de decimale cijfers te bepalen.
Voorbeeld
Invoer:
België
6.9
80.0
7.1
Uitvoer:
De HPI van België is 77.75.
Voorbeeld
Invoer:
Duitsland
6.7
80.4
4.6
Uitvoer:
De HPI van Duitsland is 117.10.
| Added by: | Peter Dawyndt |
| Date: | 2015-09-17 |
| Time limit: | 10s |
| Source limit: | 50000B |
| Memory limit: | 1536MB |
| Cluster: | Cube (Intel G860) |
| Languages: | PY_NBC |


 RSS
RSS