| Submit | All submissions | Best solutions | Back to list |
PROG0219 - Mercator projection |
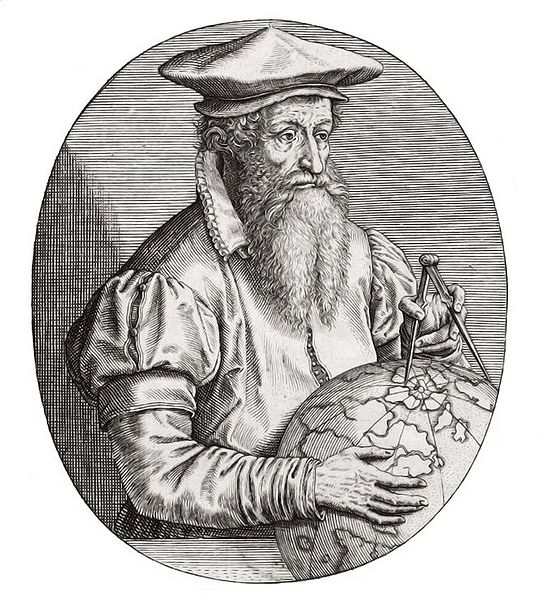
The Mercator map must be one of the most famous map projections in the history of shipping. It was named after the Flemish cartographer Gerardus Mercator, who introduced this projection in 1569. Norman Thrower wrote about this Mercator map: 'Just like other projections, the Mercator is conformal (the angles are represented correctly), but it also has a unique property: straight lines are loxodromes (lines with a constant compass point)'. This last property was of great value to the ship navigators that needed to determine their course using compasses and other means to direct their ship in the right geographical direction. The English mathematician Edward Wright also analyzed the fascinating properties of the map in his Certain Errors in Navigation from 1599. At the beginning of the 18th century, the use of the Mercator map increased after the invention of the ship chronometer, a new sort of watch with which the longitude could be determined.
The Mercator projection or normal conform projection converts a longitude $\lambda$ ($-180^{\circ} < \lambda \leq 180^{\circ}$) and a latitude $\varphi$ ($-90^{\circ} \leq \varphi \leq 90^{\circ}$) of a location expressed in spherical co-ordinates in cartesian co-ordinates $(x,y)$ in a flat area. The projection is characterized by the following comparisons: \[ \begin{array}{rcl} x &=& R(\lambda - \lambda_0) \\ y &=& \frac{R}{2} \ln\left(\frac{1 + \sin\varphi}{1 - \sin\varphi}\right) \end{array} \] Here, $\lambda$ and $\varphi$ are expressed in radians, and $\lambda_0$ indicates the longitude that is projected onto the centre of the map. The value $R$ represents the radius of the earth (6378,1 kilometres). Based on these formulas, one can easily deduct an important flaw of the Mercator projection: areas that are far from the equator, are enlarged. Because of this deformation, Greenland looks like it has the same size as Africa, while Africa is actually fourteen times bigger.
Assignment
Write a function mercatorprojection, to which three real numbers are given as an argument: the longitude $\lambda_0$ that is portrayed in the centre of the map, and the longitude $\lambda$ and latitude $\varphi$ of a point on earth in spherical co-ordinates. These three co-ordinates are expressed in decimal notation. The function has to print a tuple $(x, y)$ as a result that indicates the location in cartesian co-ordinates x and y. For the earth's radius you may use 6378.1 kilometers, and also the values $x$ and $y$ must be expressed in kilometers. Look at section 6.7 of the text book to see how to make sure a function prints a tuple as a result.
Example
>>> mercatorprojection(25.0, 125.50, 40.0)
(11187.54392465576, 4865.914051846049)
>>> mercatorprojection(0.0, 0.0, 0.0)
(0.0, 0.0)
>>> mercatorprojection(-120.0, 22.55, -13.70)
(15868.501357807745, -1539.8116898053572)
>>> mercatorprojection(-5.78, 22.0, 88.80)
(3092.43751469589, 29077.860165059174)
>>> mercatorprojection(-5.78, -55.78, 88.80)
(-5565.942251072516, 29077.860165059174)
De Mercatorkaart moet zowat één van de beroemdste kaartprojecties zijn uit de geschiedenis van de scheepvaart. Ze werd vernoemd naar de Vlaamse cartograaf Gerardus Mercator, die deze projectie in 1569 introduceerde. Over de Mercatorkaart schreef Norman Thrower: 'Net als andere projecties is de Mercator hoekgetrouw (de hoeken worden juist weergegeven), maar ze heeft ook een unieke eigenschap: rechte lijnen zijn loxodromen (lijnen met een constante kompasrichting)'. Deze laatste eigenschap was van onschatbare waarde voor scheepsnavigatoren die hun koers moesten bepalen met behulp van kompassen en andere middelen om hun schip de juiste geografische richting uit te sturen. De Engelse wiskundige Edward Wright analyseerde de fascinerende eigenschappen van de kaart in zijn Certaine Errors in Navigation (navigatiefouten) uit 1599. Begin 18de eeuw nam het gebruik van de Mercatorkaart sterk toe na de uitvinding van de scheepschronometer, een soort van uurwerk waarmee de lengtegraad kon bepaald worden.
De Mercatorprojectie of normale conforme projectie zet een lengtegraad $\lambda$ ($-180^{\circ} < \lambda \leq 180^{\circ}$) en een breedtegraad $\varphi$ ($-90^{\circ} \leq \varphi \leq 90^{\circ}$) van een plaatsaanduiding uitgedrukt in bolcoördinaten om in carthesische coördinaten $(x,y)$ op een plat vlak. De projectie wordt gekenmerkt door volgende vergelijkingen: \[ \begin{array}{rcl} x &=& R(\lambda - \lambda_0) \\ y &=& \frac{R}{2} \ln\left(\frac{1 + \sin\varphi}{1 - \sin\varphi}\right) \end{array} \] Hierbij worden $\lambda$ en $\varphi$ uitgedrukt in radialen, en geeft $\lambda_0$ de lengtegraad aan die op het midden van de kaart wordt geprojecteerd. De waarde $R$ staat voor de straal van de aarde (6378,1 kilometer). Op basis van deze formules valt ook een belangrijk gebrek van de Mercatorprojectie af te leiden: gebieden die ver van de evenaar verwijderd liggen worden immers sterk uitvergroot weergegeven. Door deze vervorming lijkt Groenland bijvoorbeeld ongeveer even groot als Afrika, terwijl Afrika in werkelijkheid veertien keer groter is.
Opgave
Schrijf een functie mercatoprojectie waaraan drie reële getallen als argument moeten doorgegeven worden: de lengtegraad $\lambda_0$ die op het midden van de kaart wordt afgebeeld, en de lengtegraad $\lambda$ en breedtegraad $\varphi$ van een punt op aarde uitgedrukt in bolcoördinaten. Deze drie coördinaten worden uitgedrukt in decimale notatie. De functie moet als resultaat een tuple $(x, y)$ teruggeven dat de plaats van het punt uitdrukt in carthesische coördinaten x en y. Als straal van aarde mag de functie uitgaan van 6378,1 kilometer, en ook de waarde $x$ en $y$ moeten uitgedrukt worden in kilometer. Bekijk sectie 6.7 van het handboek om te zien hoe je ervoor kan zorgen dat een functie een tuple als resultaat teruggeeft.
Voorbeeld
>>> mercatorprojectie(25.0, 125.50, 40.0)
(11187.54392465576, 4865.914051846049)
>>> mercatorprojectie(0.0, 0.0, 0.0)
(0.0, 0.0)
>>> mercatorprojectie(-120.0, 22.55, -13.70)
(15868.501357807745, -1539.8116898053572)
>>> mercatorprojectie(-5.78, 22.0, 88.80)
(3092.43751469589, 29077.860165059174)
>>> mercatorprojectie(-5.78, -55.78, 88.80)
(-5565.942251072516, 29077.860165059174)
| Added by: | Peter Dawyndt |
| Date: | 2012-02-10 |
| Time limit: | 10s |
| Source limit: | 50000B |
| Memory limit: | 1536MB |
| Cluster: | Cube (Intel G860) |
| Languages: | PY_NBC |
| Resource: | None |


 RSS
RSS