| Submit | All submissions | Best solutions | Back to list |
PROG0205 - Hydrophobicity |
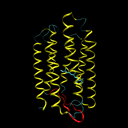
Bacteriorhodopsine is a 7-transmembrane protein, which means that it is built from seven helices that cross the cell membrane (see the left figure below). As a consequence, this protein must consist of seven hydrophobic (water resistant) segments that don't react with the greasy cell membrane, alternating with the hydrophylic segments that don't react with the watery cytoplasm and the environment outside the cell. To every amino acid of a protein, a gradation of hydrophobicity can be appointed, ranging from very hydrophobic to very hydrophilic. The table underneath (right) gives the hydrophobicity values for various amino acids (positive values are hydrophobic and negative values are hydrophylic) as they were determined by Kyte and Doolittle.
| residu | value |
|---|---|
| A | 1.8 |
| R | -4.5 |
| N | -3.5 |
| D | -3.5 |
| C | 2.5 |
| Q | -3.5 |
| E | -3.5 |
| G | -0.4 |
| H | -3.2 |
| I | 4.5 |
| residu | value |
|---|---|
| L | 3.8 |
| K | -3.9 |
| M | 1.9 |
| F | 2.8 |
| P | -1.6 |
| S | -0.8 |
| T | -0.7 |
| W | -0.9 |
| Y | -1.3 |
| V | 4.2 |
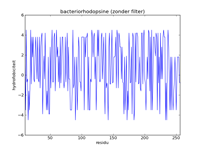
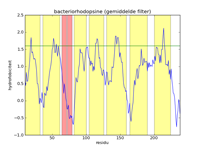
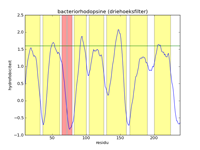
The left figure below gives a picture of the list with data points that represent the hydrophobicityvalues of bacteriorhodopsine. A hydrofobicityvalue gives the chance a certain amino acid occurs in a hydrophobic region. However, it is not an exact prophecy. An amino acid with a high hydrophobicity can still occur in water, and vice versa. Because of this the signal contains a lot of noise, and it is almost impossible to find hydrophobic regions in this figure. By applying a mathematical filter technique, the noise can be suppressed. In the middle figure, for example, a mean filter was used, and the seven helices are indicated with yelow strips. Here we can obviously see that the filtering strengthens the signal, and the peaks of high hydrofobicity can clearly be linked to the regions where the helices are. The right-hand figure is analogue to the middle figure, but uses a triangle filter. The effect is that the signal is further strengthened.
Assignment
- Write a function hydrofobicity to which two obligatory arguments must be given: a protein sequence (string consisting of letters representing amino acids) and a dictionary that portrays each amino acid on a corresponding hydrofobicityvalue. The function must print a list as a result with the hydrofobicityvaues of the consecutive amino acids of the protein sequence.
- Suppose we possess over a list of data
points we represent as $x_0, x_1, \ldots, x_n$. A filter consists of a
list of weights $w_0, w_1, \ldots, w_m$ (with $m$ even and $m \leq n$).
By applying the filter to a list of data points we obtain a new
(flattened) list of data points $y_0, y_1, \ldots y_{n-m}$, of which the
values are calculated as follows
\[
y_i = \frac{\displaystyle\sum_{j=0}^m w_j x_{i+j}}{\displaystyle\sum_{j=0}^m w_j},\ 0 \leq i \leq n-m
\] Write a function filter to which two arguments must be given: a list of data points and a list of weights. The data points and the weights are integers. The function must print a flattened list of data points that is the result after applying the filter to the original list of data points. - If all weights of the filter have the same value $w$ ($w \neq 0$), the filter calculates the mean of the value of a data point and a number of neighbouring points right and left from that point. If we use the list [1, 1, 1, 1, 1] as a filter, for example, 5 points are leveled out (one point and two points left and right). We name this a mean filter with width $b = 5$. Analogue, a mean filter with width $b = 7$ uses the list [1, 1, 1, 1, 1, 1, 1]as a filter. Use the function filter to write a function filterMean to which an obligatory list of data points (argument datapoints) and optionally a width $b$ (argument width; use $b=5$ as a standard value) must be given. This function must print the flattened list of data points that results after applying a mean filter with width $b$ as a result. If the given width $b$ is even, the function must increase by 1 (the width must always be uneven).
- A triangle filter uses a filter that increases from 1 in the first half, and starts decreasing halfway. For example, the triangle filter with width $b=5$ uses the filter [1, 2, 3, 2, 1], a triangle filter with width $b=7$ uses the filter [1, 2, 3, 4, 3, 2, 1], and so on. Use the function filter to write a function filterTriangle to which an obligatory list of data points (argument datapoints) and an optional width $b$ (argument width; use $b=5$ as a standard value) must be given. This function must print the flattened list of data points that results after applying a triangle filter with width $b$. If the given width $b$ is even, the function must increase by 1 (the width must always be uneven).
Example
>>> protein = 'AQITGRPEWI'
>>> kd = {
...     'A': 1.8, 'R':-4.5, 'N':-3.5, 'D':-3.5, 'C': 2.5,
...     'Q':-3.5, 'E':-3.5, 'G':-0.4, 'H':-3.2, 'I': 4.5,
...     'L': 3.8, 'K':-3.9, 'M': 1.9, 'F': 2.8, 'P':-1.6,
...     'S':-0.8, 'T':-0.7, 'W':-0.9, 'Y':-1.3, 'V': 4.2
... }

>>> datapoints = hydrofobicity(protein, kd)
>>> datapoints
[1.8, -3.5, 4.5, -0.7, -0.4, -4.5, -1.6, -3.5, -0.9, 4.5]

>>> filterMean(datapoints)
[0.34, -0.92, -0.54, -2.14, -2.18, -1.2]
>>> filterMean(datapoints, width=5)
[0.34, -0.92, -0.54, -2.14, -2.18, -1.2]

>>> filterTriangle(datapoints, width=3)
[-0.175, 1.2, 0.675, -1.5, -2.75, -2.8, -2.375, -0.2]
Bacteriorhodopsine is een 7-transmembraan eiwit, wat betekent dat het is opgebouwd uit zeven helices die het celmembraan doorkruisen (zie onderstaande figuur, links). Als gevolg hiervan moet dit eiwit bestaan uit zeven hydrofobe (waterafstotende) segmenten die niet reageren met het vette celmembraan, afgewisseld met hydrofiele segmenten die niet reageren met het waterige cytoplasma en de omgeving buiten de cel. Aan elk aminozuur van een eiwit kan een gradatie van hydrofobiciteit toegekend worden, gaande van zeer hydrofoob naar zeer hydrofiel. Onderstaande tabel (rechts) geeft de hydrofobiciteitswaarden voor de verschillende aminozuren (positieve waarden zijn hydrofoob en negatieve waarden zijn hydrofiel) zoals die werden bepaald door Kyte en Doolittle.
| residu | waarde |
|---|---|
| A | 1.8 |
| R | -4.5 |
| N | -3.5 |
| D | -3.5 |
| C | 2.5 |
| Q | -3.5 |
| E | -3.5 |
| G | -0.4 |
| H | -3.2 |
| I | 4.5 |
| residu | waarde |
|---|---|
| L | 3.8 |
| K | -3.9 |
| M | 1.9 |
| F | 2.8 |
| P | -1.6 |
| S | -0.8 |
| T | -0.7 |
| W | -0.9 |
| Y | -1.3 |
| V | 4.2 |
De linker figuur hieronder geeft een afbeelding van de lijst met datapunten die de hydrofobiciteitswaarden van bacteriorhodopsine voorstellen. Een hydrofobiciteitswaarde geeft de kans aan dat een bepaald aminozuur in een hydrofobe regio voorkomt. Het is echter geen exacte voorspelling. Een aminozuur met een hoge hydrofobiciteit kan nog steeds in water voorkomen, en omgekeerd. Hierdoor bevat het signaal heel veel ruis, en is het vrijwel onmogelijk om hydrofobe regio's te vinden in deze figuur. Door toepassing van een wiskundige filtertechniek kan de ruis onderdrukt worden. In de middelste figuur werd bijvoorbeeld gebruik gemaakt van een gemiddelde filter, en worden de zeven helices aangegeven als gele stroken. Hierin zien we duidelijk dat de filtering het signaal versterkt, en kunnen de pieken van hoge hydrofobiciteit duidelijk gelinkt worden aan de regio's waar de helices zich bevinden. De rechter figuur is analoog aan de middelste figuur, maar maakt gebruik van een driehoeksfilter. Het effect is dat het signaal nog verder versterkt wordt.
Opgave
- Schrijf een functie hydrofobiciteit waaraan twee verplichte argumenten moeten doorgegeven worden: een eiwitsequentie (string bestaande uit letters die aminozuren voorstellen) en een dictionary die elk aminozuur afbeeldt op een corresponderende hydrofobiciteitswaarde. De functie moet als resultaat een lijst teruggeven met de hydrofobiciteitswaarden van de opeenvolgende aminozuren van de eiwitsequentie.
- Stel dat we beschikken over een lijst van
datapunten die we voorstellen als $x_0, x_1, \ldots, x_n$. Een filter
bestaat uit een lijst van gewichten $w_0, w_1, \ldots, w_m$ (met $m$
even en $m \leq n$). Door de filter toe te passen op de lijst van
datapunten bekomen we een nieuwe (afgevlakte) lijst van datapunten $y_0,
y_1, \ldots y_{n-m}$, waarvan de waarden op de volgende manier berekend
worden.
\[
y_i = \frac{\displaystyle\sum_{j=0}^m w_j x_{i+j}}{\displaystyle\sum_{j=0}^m w_j},\ 0 \leq i \leq n-m
\]Schrijf een functie filter waaraan twee argumenten moeten doorgegeven worden: een lijst van datapunten en een lijst van gewichten. De datapunten en gewichten zijn reële getallen. De functie moet de afgevlakte lijst van datapunten teruggeven die resulteert na toepassing van de filter op de oorspronkelijke lijst van datapunten. - Als alle gewichten van de filter eenzelfde waarde $w$ ($w \neq 0$) hebben, dan berekent de filter het gemiddelde van de waarde van een datapunt en een aantal naburige punten links en rechts van dit punt. Als we bijvoorbeeld de lijst [1, 1, 1, 1, 1] als filter gebruiken, dan worden 5 punten uitgemiddeld (een punt en twee punten links en rechts). We noemen dit een gemiddelde filter met breedte $b = 5$. Analoog gebruikt een gemiddelde filter met breedte $b = 7$ als filter de lijst [1, 1, 1, 1, 1, 1, 1]. Gebruik de functie filter om een functie filterGemiddelde te schrijven waaraan verplicht een lijst van datapunten (argument datapunten) en optioneel een breedte $b$ (argument breedte; gebruik $b=5$ als standaardwaarde) moeten doorgegeven worden. Deze functie moet als resultaat de afgevlakte lijst van datapunten teruggeven die resulteert na toepassing van een gemiddelde filter met breedte $b$. Indien de opgegeven breedte $b$ even is, dan moet de functie die met 1 verhogen (de breedte moet immers altijd oneven zijn).
- Een driehoeksfilter maakt gebruik van een filter die in het eerste deel oploopt vanaf 1, en halverwege terug begint af te lopen. Zo maakt een driehoeksfilter met breedte $b=5$ gebruik van de filter [1, 2, 3, 2, 1], een driehoeksfilter met breedte $b=7$ van de filter [1, 2, 3, 4, 3, 2, 1], enzoverder. Gebruik de functie filter om een functie filterDriehoek te schrijven waaraan verplicht een lijst van datapunten (argument datapunten) en optioneel een breedte $b$ (argument breedte; gebruik $b=5$ als standaardwaarde) moeten doorgegeven worden. Deze functie moet als resultaat de afgevlakte lijst van datapunten teruggeven die resulteert na toepassing van een driehoeksfilter met breedte $b$. Indien de opgegeven breedte $b$ even is, dan moet de functie die met 1 verhogen (de breedte moet immers altijd oneven zijn).
Voorbeeld
>>> eiwit = 'AQITGRPEWI'
>>> kd = {
...     'A': 1.8, 'R':-4.5, 'N':-3.5, 'D':-3.5, 'C': 2.5,
...     'Q':-3.5, 'E':-3.5, 'G':-0.4, 'H':-3.2, 'I': 4.5,
...     'L': 3.8, 'K':-3.9, 'M': 1.9, 'F': 2.8, 'P':-1.6,
...     'S':-0.8, 'T':-0.7, 'W':-0.9, 'Y':-1.3, 'V': 4.2
... }

>>> datapunten = hydrofobiciteit(eiwit, kd)
>>> datapunten
[1.8, -3.5, 4.5, -0.7, -0.4, -4.5, -1.6, -3.5, -0.9, 4.5]

>>> filterGemiddelde(datapunten)
[0.34, -0.92, -0.54, -2.14, -2.18, -1.2]
>>> filterGemiddelde(datapunten, breedte=5)
[0.34, -0.92, -0.54, -2.14, -2.18, -1.2]

>>> filterDriehoek(datapunten, breedte=3)
[-0.175, 1.2, 0.675, -1.5, -2.75, -2.8, -2.375, -0.2]
| Added by: | Peter Dawyndt |
| Date: | 2012-01-12 |
| Time limit: | 10s |
| Source limit: | 50000B |
| Memory limit: | 1536MB |
| Cluster: | Cube (Intel G860) |
| Languages: | PY_NBC |
| Resource: | None |


 RSS
RSS